.jpg)
















Is There Any Effect Of AI Bubble On Indian Stock Market?







Summary
The 4 O’s of the AI bubble overinvestment, overvaluation, over-ownership, over-leverage split the Indian stock market in two: Nifty IT crashed over 40% from its December 2024 peak, while AI-infrastructure stocks like Netweb Technologies more than doubled. India briefly lost its MSCI top-10 spot in June 2026, but by July, the Nifty 50 was trading like a hedge again.
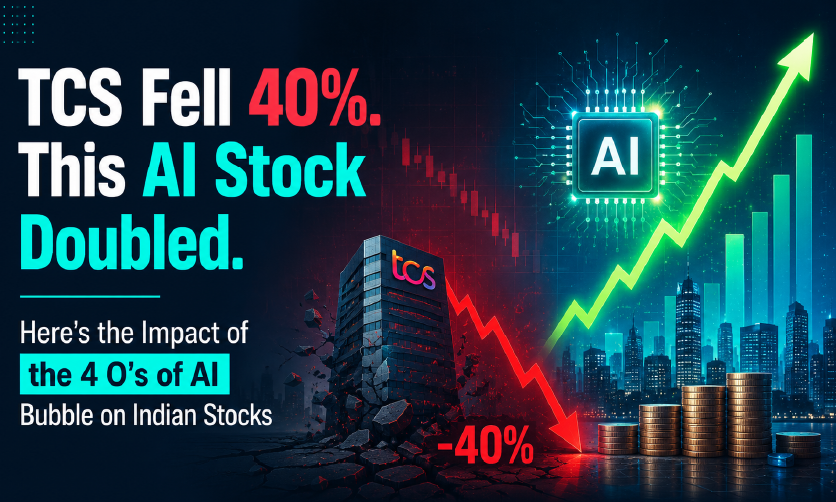
If you bought TCS shares at their all-time high in late 2024, you’re sitting on a loss of close to 40% today.
If you’d put that same money into Netweb Technologies, a little-known Indian AI hardware maker, you’d have more than doubled it.
Same stock market. Same 18-month window. Two opposite outcomes.
That gap is the real story behind the “4 O’s of the AI bubble,” a framework economist Ruchir Sharma popularised in December 2025. What began as a warning about US tech valuations has turned into one of the biggest forces behind stock market volatility in 2026, and it has split Indian equities into clear winners and genuinely bruised losers.
Here’s what actually happened, with the numbers, and what it means if you’re holding Indian stocks right now.
Table of Contents
- What Is the Impact of the 4 O’s of the AI Bubble in the Indian Stock Market?
- How Did the AI Bubble Actually Hit Indian Stock Prices?
- Why Did Indian IT Stocks Fall so Hard?
- Is India Still a Place of Safety From the AI Bubble?
- Stock Market Volatility 2026
- Is the Indian Stock Market Overvalued Right Now?
- What Should You Do as an Investor in 2026?
- The Bottom Line
- Frequently Asked Questions
What Is the Impact of the 4 O’s of the AI Bubble in the Indian Stock Market?
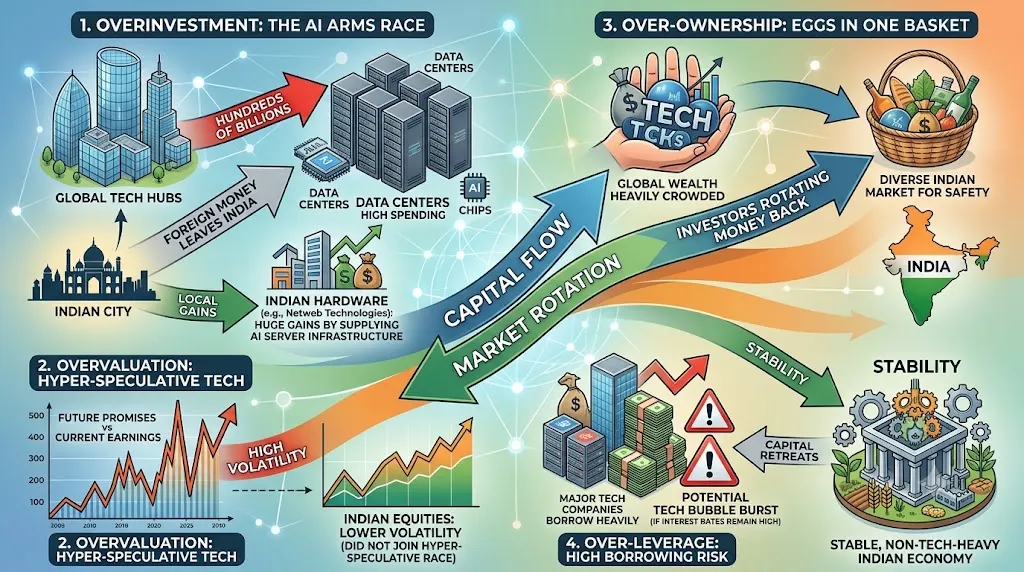
Renowned economist Ruchir Sharma, Chairman of Rockefeller International, recently diagnosed the global AI craze using four distinct warnings: Overinvestment, Overvaluation, Over-ownership, and Over-leverage. While these four factors are creating massive waves globally, their impact on the Indian stock market is behaving like a shield.
Here is what the 4 O’s means:
- Overinvestment: Tech giants are spending hundreds of billions of dollars building massive data centers and buying AI chips. Initially, this caused foreign money to leave India to chase quick tech profits in places like Taiwan. However, local Indian hardware companies (like Netweb Technologies) saw huge gains by supplying AI server infrastructure.
- Overvaluation: A lot of global artificial intelligence stock valuation is based on future promises rather than actual current earnings. Because Indian equities didn’t join this hyper-speculative tech race, our markets are showing relatively lower volatility.
- Over-ownership: Global wealth is heavily crowded into just a few massive tech stocks. As investors realize they have put all their eggs in one basket, they are rotating their money back into the diverse Indian market to stay safe.
- Over-leverage: Major tech companies are borrowing heavily to fund this AI arms race. If interest rates remain high and the global tech bubble bursts, capital will likely retreat straight into the stable, non-tech-heavy Indian economy.
Sharma’s own view was blunt: the AI trade was flashing warnings on all four measures at once, something he hadn’t said about earlier tech run-ups. His call, made in late 2025, was that rising interest rates would be the spark that eventually pops it.
How Did the AI Bubble Actually Hit Indian Stock Prices?
Framework aside, here’s what happened to real prices between the pre-bubble-fear period (late 2024) and now.
| Stock / Index | Pre-bubble peak | 2026 level | Change |
|---|---|---|---|
| Nifty IT Index | 46,089 (13 Dec 2024) | 26,299 (30 Jun 2026 close) | down ~43% |
| TCS | ₹3,426 (52-week high) | ₹2,080 (8 Jul 2026); low of ₹1,977 | down ~39% |
| Infosys | ₹1,728 (52-week high) | ₹1,072 (7 Jul 2026); low of ₹982 | down ~36% |
| Nifty 50 (broad index) | 26,373 (52-week high) | 24,399 (7 Jul 2026) | down ~5% over 12 months |
| Netweb Technologies (AI infra) | ₹1,700–1,775 (52-week low) | ₹4,170 (8 Jul 2026) | up ~59% YTD, over 2x its 52-week low |
Price levels sourced from NSE/BSE-linked data via Kotak Neo, Tickertape, Trendlyne and Groww, as of the dates shown.
A Few Things Stand Out:
The damage has been concentrated in IT, not the whole market. The broad Nifty 50 is down only around 5% over 12 months. Nifty IT alone has absorbed a hugely disproportionate share of the pain, logging its worst run since at least 2023.
AI infrastructure did the opposite of crashing. Netweb Technologies doesn’t sell the kind of coding and support services AI might replace; it sells the physical servers and computing hardware AI needs to run. Its FY26 revenue grew 90% year-on-year, and its share price has more than doubled off its 52-week low, even after pulling back from its own 52-week high of ₹5,244. Even the AI winners aren’t immune to swings.
That’s the part most coverage misses: this hasn’t been one uniform AI bubble effect on India. It’s been a rotation, real money leaving one part of the market and landing in another.
Why Did Indian IT Stocks Fall so Hard?
Two forces converged on the sector:
- Direct disruption fear. TCS, Infosys, HCL Technologies, Wipro and Tech Mahindra run on large teams doing coding, testing, and maintenance for global clients. Each time a new AI coding tool launches promising to automate that kind of work, IT stocks sell off within hours. That pattern repeated through February, March, and June 2026.
- Client budget caution. When Accenture, TCS’s closest global peer, cut its own revenue growth guidance in June 2026, its US stock fell roughly 18% in a single session. Indian IT felt the shockwave the very next day, with TCS alone dropping over 6%.
IT’s overall weight in the Nifty 50 fell from 10.8% to 9.2% within the first two weeks of February 2026 alone, handing its number-two sector spot to Oil & Gas. By July, the five largest IT companies combined made up less than 7.6% of the index, the lowest combined weight since at least 2002.
Is India Still a Place of Safety From the AI Bubble?
This is the part most explainers skip, because it isn’t a straight line.
December 2025: Sharma’s framework goes viral, and analysts start floating India as a natural hedge against a US-led AI correction, since Indian markets carry almost no direct AI exposure.
February–June 2026: That thesis takes a beating. Instead of rotating into India, global money rotates into Taiwan and South Korea, the countries that actually manufacture AI chips. Taiwan Semiconductor’s weight in the MSCI Emerging Markets Index overtakes India’s, and by June, no Indian company remains in the index’s top 10 for the first time in 26 years. HDFC Bank and Reliance Industries, India’s two biggest constituents, slip from 7th and 8th place to 11th and 12th. Foreign investors pull roughly ₹2.76 lakh crore out of Indian equities in 2026 alone.
Late June–July 2026: The thesis starts working again. In June, the Nifty 50 outperforms the MSCI Emerging Markets Index by the widest margin since November 2025. Foreign outflows shrink to a four-month low. India’s volatility index (VIX) falls for a third straight month, and Goldman Sachs upgrades Indian equities to overweight, projecting 13–14% upside for benchmark indices by year-end.
So the honest answer: India lost ground as an AI hedge for most of the first half of 2026, and the most recent data suggests that thesis is starting to hold again, right as fresh worries about a global AI correction resurface.
Stock Market Volatility 2026
Volatility measures how sharply and how often prices swing, not just which direction they’re heading. By that measure, 2026 has been a split year for India: contained at the index level, sharp at the sector level.
How India compares globally. In the first half of 2026, the Nifty 50 logged 38 trading sessions with moves of 1% or more, according to Business Standard’s analysis of exchange data. That’s a bit more than the S&P 500’s 32 sessions, but well below the MSCI Emerging Markets Index’s 59 and nowhere close to South Korea’s Kospi, which swung 1%+ on 79 days, roughly two-thirds of the half-year, as AI-linked chip stocks whipsawed investors.
| Index | Sessions with ≥1% moves (H1 2026) |
|---|---|
| S&P 500 (US) | 32 |
| Nifty 50 (India) | 38 |
| MSCI Emerging Markets | 59 |
| Kospi (South Korea) | 79 (~two-thirds of trading days) |
The India VIX spiked to a one-year high relative to the US Cboe VIX in April 2026, right after the Nifty 50 tanked to a low. It then fell for three straight months through June, dropping below its one-year average and touching its lowest level since February by early July, a sign that broad-market nerves have eased even as bubble headlines kept coming.
Where the real turbulence hit. The index-level calm hides some genuinely sharp shocks lower down:
- 12 February 2026: Nifty IT fell 5.51% in a single session after a fresh wave of AI-disruption fears.
- February 2026, full month: Nifty IT lost around 21% for the month alone, its worst monthly showing in almost 23 years, wiping out roughly $18.6 billion in combined market value across its 10 constituents.
- 27 March 2026: The broad Nifty 50 dropped 486.85 points (2.09%) in one session on heavy foreign selling.
- 19 June 2026: TCS fell over 6% in a day after Accenture’s guidance cut triggered an 18% single-session crash in Accenture’s own US stock.
That’s the real shape of stock market volatility in 2026: the headline index moved in a relatively contained range all year, while AI-news-driven shocks repeatedly hit IT stocks several times harder than anything the general market went through.
Is the Indian Stock Market Overvalued Right Now?
Not by the numbers. As of early July 2026, the Nifty 50’s price-to-earnings ratio sits at roughly 20.9, about 14% below its 10-year average of 23.43. That puts the broad Indian market in fairly valued territory, not bubble territory, on standard valuation bands.
Compare that with the worry driving the AI bubble narrative in the first place: artificial intelligence stock valuations in the US have priced in years of uninterrupted, exceptional earnings growth, exactly the pattern Sharma flagged as overvaluation. Indian equities are increasingly being bought precisely because they aren’t priced for that kind of perfection.
What Should You Do as an Investor in 2026?
This is general market information, not advice tailored to your personal finances. Treat it as a starting framework, not a set of instructions. A few things the current data makes clear:
- Don’t treat “Indian IT” as one trade. The sector has split hard. Tier-1 giants like TCS and Infosys remain under pressure, while smaller, more specialised players like KPIT Technologies have drawn “Buy” ratings from brokerages, even as the same brokerages rate TCS, Infosys, HCLTech, Wipro and LTIMindtree a “Sell.” Painting the whole sector with one brush, bullish or bearish, misses what’s actually happening stock by stock.
- Watch valuation, not just the size of the fall. A 40% drop sounds dramatic, but TCS and Infosys are still trading at P/E ratios in the high-teens to low-twenties, roughly in line with global peers like Accenture. A falling price isn’t automatically a bargain, and a rising one isn’t automatically a bubble. Check the multiple against history and peers before reacting to the headline.
- Know what you already own. If your mutual fund or index fund tracks the Nifty 50, your direct IT exposure has already shrunk automatically as the sector’s index weight fell. You may be more diversified than the headlines suggest.
- Track FII/DII flow data. Foreign outflows shrinking, as they did in June 2026, is one of the more reliable early signals that sentiment toward India is turning, often more useful in real time than any single “bubble bursting” headline.
- Separate AI infrastructure from AI disruption. Companies building the physical backbone AI needs (data centres, servers, chips) have broadly benefited. Companies whose labour-heavy business models AI threatens to automate have broadly suffered. Which bucket a stock falls into matters more than whether “AI” shows up in its recent news coverage.
This section is for general information only and isn’t personalised investment advice. Markets carry risk, and past performance doesn’t guarantee future results. Do your own research or speak with a SEBI-registered investment advisor before making investment decisions.
The Bottom Line
The 4 O’s didn’t hit the Indian stock market as one clean, single-direction story. It gutted Nifty IT, sent AI-infrastructure names like Netweb Technologies to multi-year gains, pushed India out of a 26-year-old MSCI ranking, and is now, as of July 2026, cautiously pulling foreign capital back in. Whichever way the AI bubble ultimately breaks, the Indian market has already shown it won’t move as a single block. That’s the detail worth watching for the rest of 2026, through Nifty IT’s next earnings season and India’s next MSCI weight update.
Few related topics for your knowledge
Frequently Asked Questions
1. What are the 4 O’s of the AI bubble?
Economist Ruchir Sharma’s 4 O’s are Overinvestment, Overvaluation, Over-ownership, and Over-leverage, four warning signs used to diagnose speculative bubbles. He introduced the framework in December 2025 to describe risk building up in AI-linked stocks, mainly in the US.
2. How much have Indian IT stocks fallen because of the AI bubble?
The Nifty IT index is down about 43% from its December 2024 peak, closing near 26,299 in June 2026. TCS and Infosys have both fallen roughly 36-40% from their 52-week highs over the same period, mainly on fears that AI tools could replace outsourced coding work.
3. Is the Indian stock market becoming a hedge against the AI bubble?
It’s mixed. India lost ground for most of early 2026 as capital chased AI winners in Taiwan and South Korea. But by June-July 2026, the Nifty 50 began outperforming emerging-market peers again, and Goldman Sachs upgraded Indian equities to overweight on hedge demand.
4. Why did India drop out of the MSCI Emerging Markets top 10?
In June 2026, India’s weight in the MSCI EM Index fell to a 6-year low of 10.87%, pushing HDFC Bank and Reliance Industries out of the top 10 for the first time in 26 years, as AI-led rallies in Taiwan Semiconductor and Korean chipmakers pulled in outsized capital.
5. Is the Indian stock market overvalued in 2026?
No. As of July 2026, the Nifty 50’s P/E ratio is around 20.9, about 14% below its 10-year average of 23.43, putting Indian equities in fairly valued territory rather than bubble territory, unlike some AI-linked US stocks trading on stretched valuations.
Data sources: NSE, MSCI, Kotak Neo, Tickertape, Trendlyne, Groww, Screener. in, Business Standard, and public brokerage commentary (Goldman Sachs, Nirmal Bang, Nuvama), as reported between December 2025 and July 2026.

- Skill Development Institute in India - September 26, 2026
- Master Data in SAP PP: The Skill Recruiters Test First - September 18, 2026
- Nobody’s Talking About These Basic Computer Skills For Beginners - September 11, 2026