.jpg)


Financial Statements of Companies: Reading Profits, Lies, and Leverage Clearly
Profits lie. Cash doesn’t. And most investors never learn the difference.
Every year, companies announce “record-breaking profits,” glossy annual reports flood inboxes, and stock prices jump on headlines alone. But beneath those impressive numbers, the real story often hides in plain sight.
A business can report massive profits and still be on the verge of collapse. It can show growth while quietly drowning in debt. It can celebrate rising revenue while struggling to collect a single rupee in actual cash.

The difference between hype and reality lives inside three documents: the Balance Sheet, the Income Statement, and the Cash Flow Statement.
Most people glance at them and feel overwhelmed. Smart investors read them like detectives.
In this guide, you’ll learn how to decode company financials clearly, spot leverage risks, detect creative accounting, and separate real performance from accounting illusions. Because once you understand where the cash is actually moving, you stop guessing and start seeing the truth.
Table of Contents
- What Are the Financial Statements of Companies?
- The Big Three: Core Components of Company Financial Statements
- The Balance Sheet
- The Income Statement (Profit and Loss Account)
- The Cash Flow Statement
- Key Ratios: The Financial Health Check
- Cash vs. Net Income: The Reality Test
- Free Cash Flow (FCF): The Ultimate Power Metric
- Spotting Creative Accounting & Window Dressing
- Financial Statements for the Digital Economy
- The Footnotes Secret: Where the Real Story Lives
- Benchmarking: What Is a “Good” Number?
- The Satyam Case Study
- Conclusion
- Frequently Asked Questions
What Are the Financial Statements of Companies?
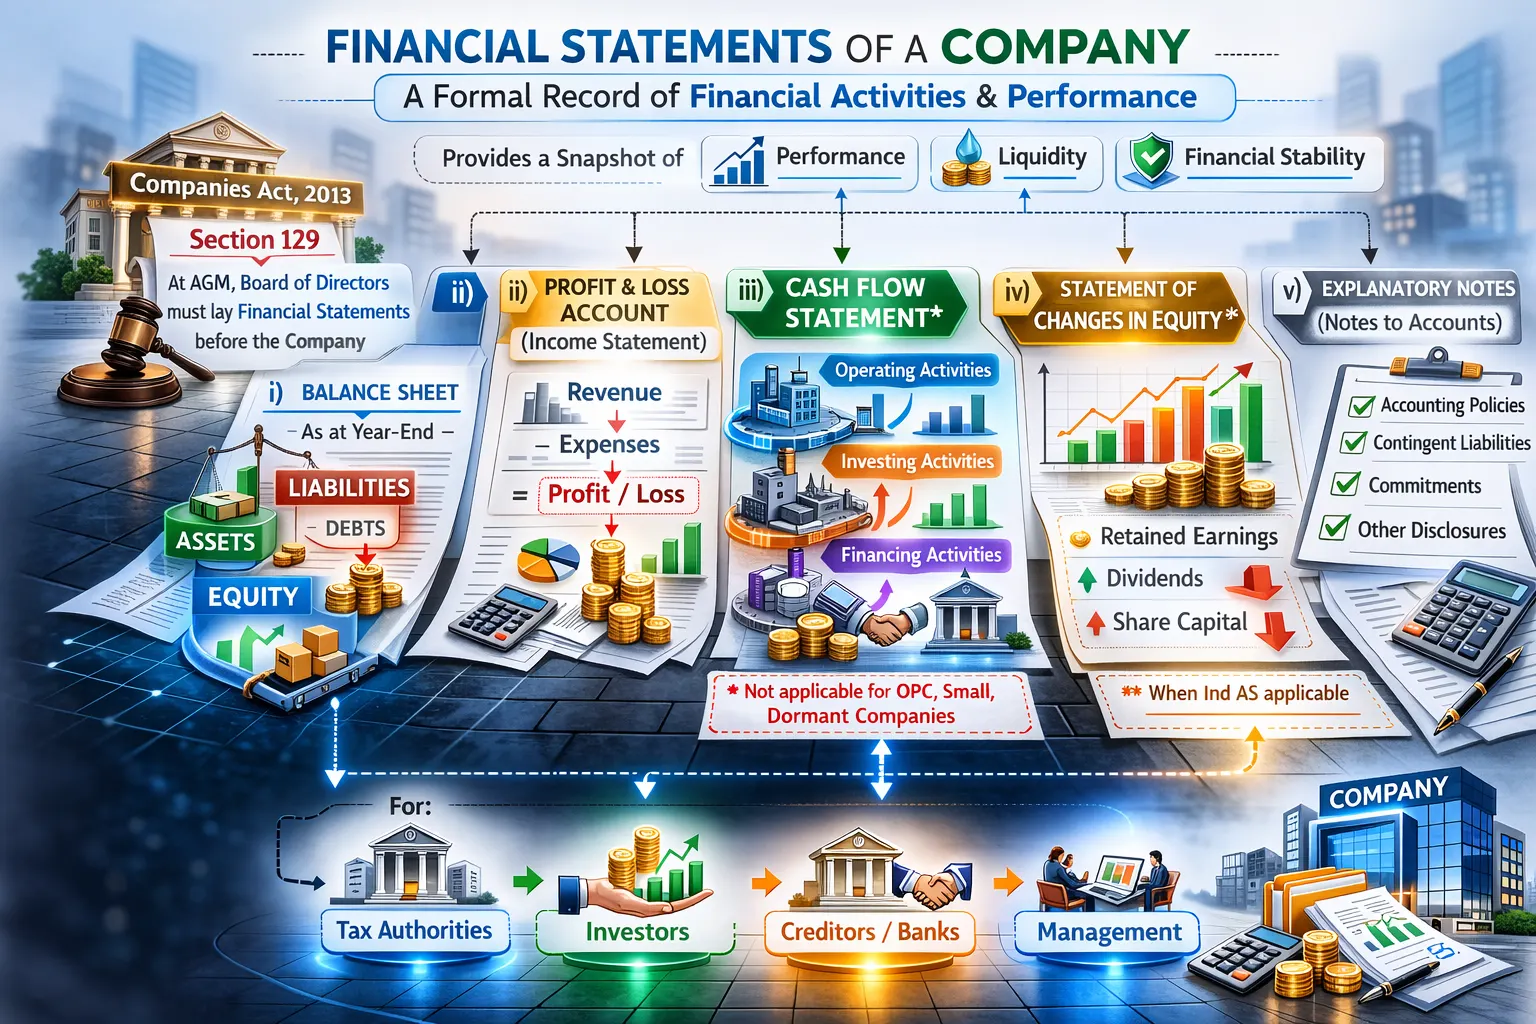
At its core, a financial statement is a formal record of the financial activities of a business. These reports provide a snapshot of a company’s performance and liquidity. They are essential for tax authorities, investors, and creditors to evaluate the firm’s stability.
As per section 129 of the Companies Act, 2013, at the annual general meeting (AGM) of a company, the board of directors should lay Financial Statements before the company.
Financial Statements of a company includes –
i) a Balance Sheet as at the end of the financial year;
ii) a Profit and Loss Account (Income Statement) or in the case of a company carrying on any activity not for profit, an Income and Expenditure Account for the financial year;
iii) Cash Flow Statement* for the financial year;
iv) a Statement of changes in equity**, if applicable; and
v) any Explanatory Note (also called Notes to Accounts) annexed to, or forming part of, any document referred to in (i) to (iv) above.
* The financial statement with respect to One Person Company, Small Company and Dormant Company may not include the cash flow statement.
** Statement of changes in equity is applicable in those companies where Ind AS is applicable
The Big Three: Core Components of Company Financial Statements
There are three primary documents you need to know:
- The Balance Sheet: What the company owns and owes.
- The Income Statement (Profit and Loss Account): How much money the company made and spent.
- The Cash Flow Statement: Where the actual cash is moving.
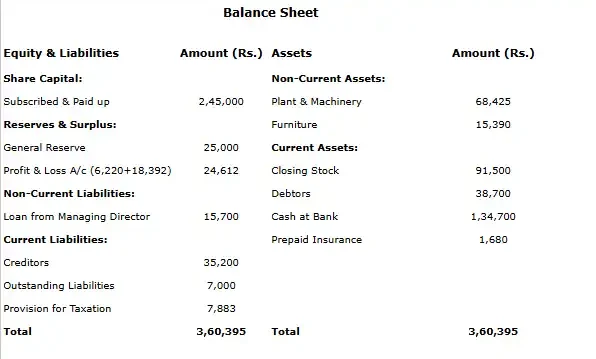
The Balance Sheet
The Balance Sheet follows a simple formula: Assets = Liabilities + Equity. It shows what the company has at a specific point in time.
- Assets: Things of value like cash, inventory, and property.
- Liabilities: Debts, such as loans or money owed to suppliers.
- Shareholders’ Equity: The money left over for owners if all debts were paid.
Key Ratios to Watch
To understand if a company is stable, look at the Debt-to-Equity Ratio. If this number is too high, the company might be taking on too much risk.
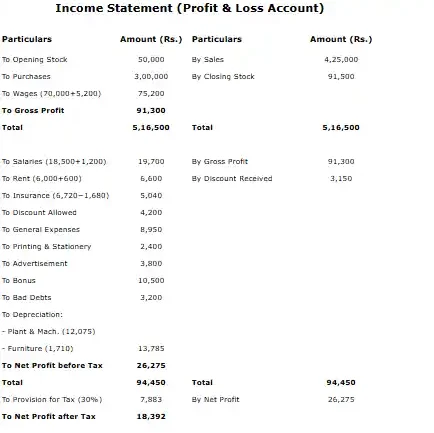
The Income Statement (Profit and Loss Account)
The Income Statement (Profit & Loss Account) tracks a company’s performance over a specific period. It answers one question: Did the company actually make money?
It uses a waterfall structure, starting with Revenue (Top Line) and subtracting expenses until it reaches Net Income (Bottom Line).
The Breakdown
- Revenue – Total sales.
- Cost of Goods Sold (COGS) = Gross Profit (Product health).
- Operating Expenses (Rent, Salaries, Ads) = Operating Profit (Business health).
- Interest & Taxes = Net Income (The Scorecard).
The Cash Flow Statement
The financial statements of companies often show a Paper Profit while the company is actually running out of money. This happens because of Accrual Accounting.
For example, a SaaS company might sign a huge contract today but not get the cash for months. The Cash Flow Statement tracks three areas:
- Operating Activities: Cash from daily business.
- Investing Activities: Buying or selling equipment/assets.
- Financing Activities: Taking out loans or paying dividends.
Tip: Always compare Cash Flow from Operations to Net Income. If Net Income is high but Operating Cash Flow is negative, the company might be “stuffing the channel” (shipping products early to inflate sales numbers).
Quick Comparison of Income Statement and Cash Flow Statement
| Feature | Income Statement | Cash Flow Statement |
|---|---|---|
| Focus | Profitability (Accrual basis) | Real Cash (Liquidity) |
| Includes | Non-cash items (Depreciation) | Only actual cash moves |
| Goal | Shows if the business is viable | Shows if the business can pay bills |
Opt for a NAAC A + AICTE approved BBA Degree1-year paid internship + 10 Simulation Software + 4 Certifications. 90% Practical Learning. |
|
| Bachelor in Accounting and Finance |
Key Ratios: The Financial Health Check
Reading financial statements without ratios is like reading a cricket score without knowing the target, the numbers lack context. While raw profit shows the score, ratios expose the structure, risk, and sustainability of the business.
1. Debt-to-Equity (D/E): The Leverage Test
Formula: Total Debt \ Shareholders’ Equity
This shows how much of the company is built on borrowed money.
- Below 1: Conservative and stable.
- Above 2: High risk; the company is heavily leveraged.
- The Trap: High debt amplifies profits during good times but can lead to a total collapse in a downturn.
2. Interest Coverage Ratio: The Safety Net
Formula: Earnings Before Interest and Taxes (EBIT) \ Interest Expense
This measures how comfortably a company pays its debt obligations.
- Below 1.5: Danger Zone, the company is barely earning enough to pay interest.
- 4+: Comfortable “Margin of Safety.”
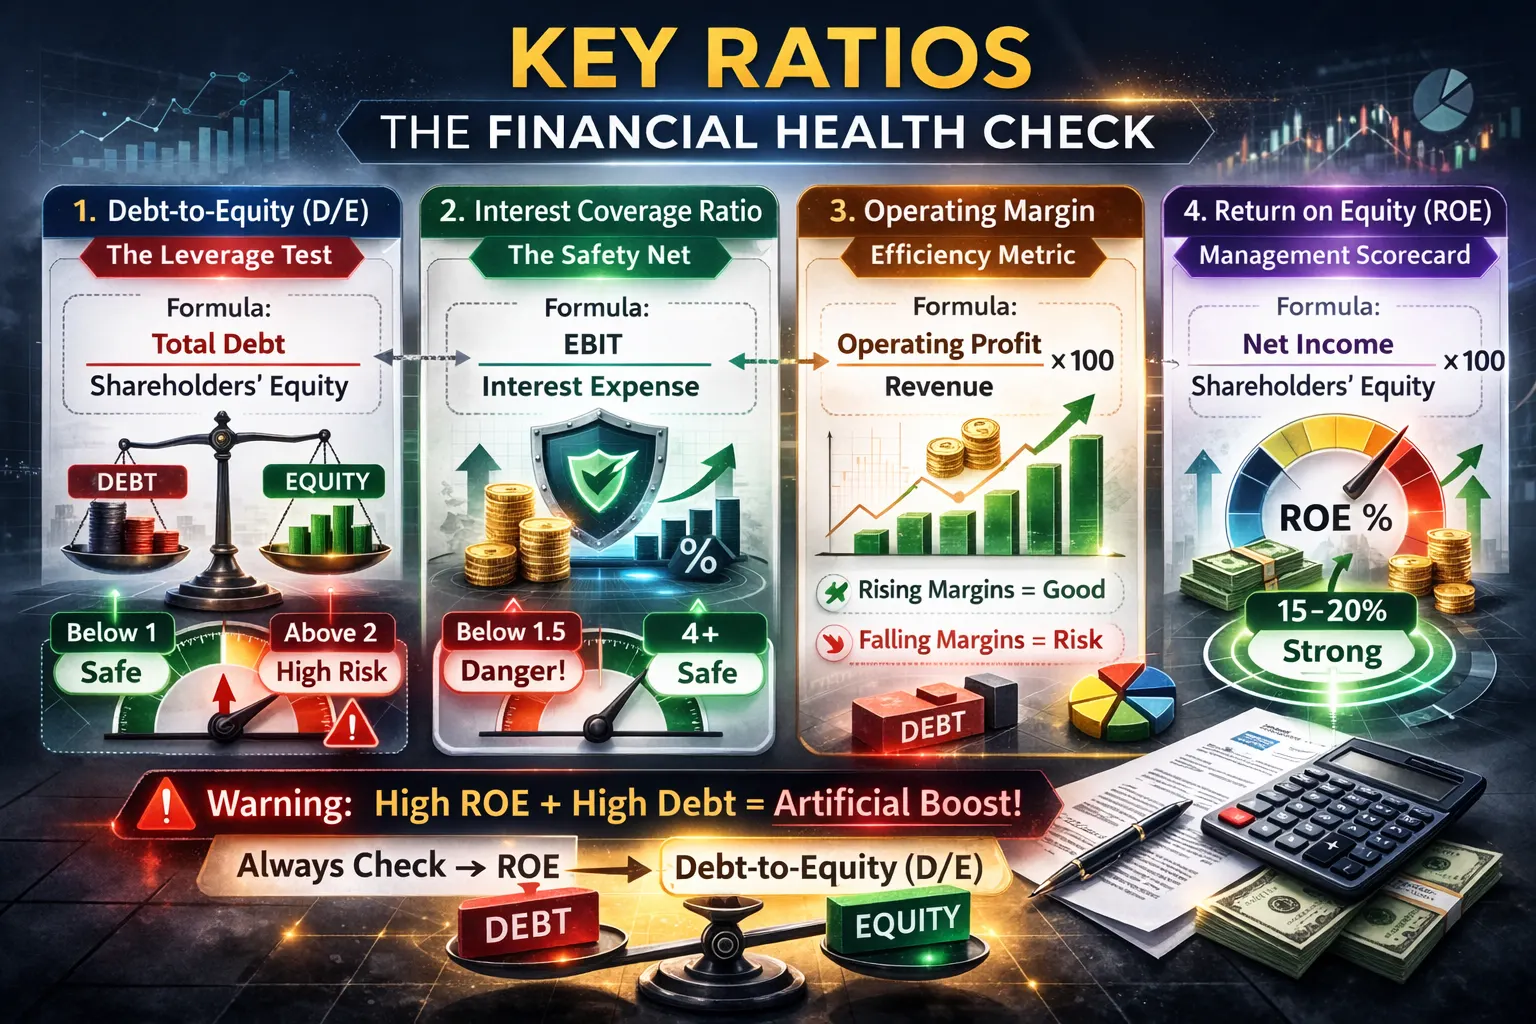
3. Operating Margin: The Efficiency Metric
Formula: Operating Profit \ Revenue
This reveals how much profit the core business generates from every rupee of sales.
- Rising Margins: Signal pricing power and cost control.
- Shrinking Margins: Even if revenue is growing, falling margins suggest the company is “buying” growth at the expense of profitability.
4. Return on Equity (ROE): The Management Scorecard
Formula: Net Income \ Shareholders’ Equity
This measures how effectively management uses investors’ capital to generate profit.
- 15–20%: Generally considered strong.
- The Warning: A high ROE paired with high debt is often an “artificial” boost. Always check ROE alongside the D/E ratio.
Cash vs. Net Income: The Reality Test
Profit is an accounting opinion; Cash is a survival fact. The most powerful test an investor can perform is comparing Net Income to Cash Flow from Operations (CFO).
Why a Profit-Cash Gap is a Red Flag:
- Rising Receivables: Sales are recorded, but customers haven’t paid. Profit goes up, but the bank balance doesn’t.
- Inventory Buildup: Cash is trapped in unsold stock. The company looks “profitable” on paper, but it’s “cash-poor” in reality.
- Aggressive Accounting: Recording sales early to hit targets, even if the cash won’t arrive for months.
Quality of Earnings Rule: In a healthy company, CFO should be equal to or greater than Net Income over the long term. If profits grow while cash shrinks, that’s not growth, that’s creative accounting.

Free Cash Flow (FCF): The Ultimate Power Metric
Formula: Operating Cash Flow – Capital Expenditure
FCF is the “surplus” cash left after maintaining the business. It is the only money that can be used to:
- Repay Debt
- Pay Dividends
- Fund Future Expansion
The Bottom Line: Companies rarely fail because of a “low profit” quarter. They fail because they run out of cash.
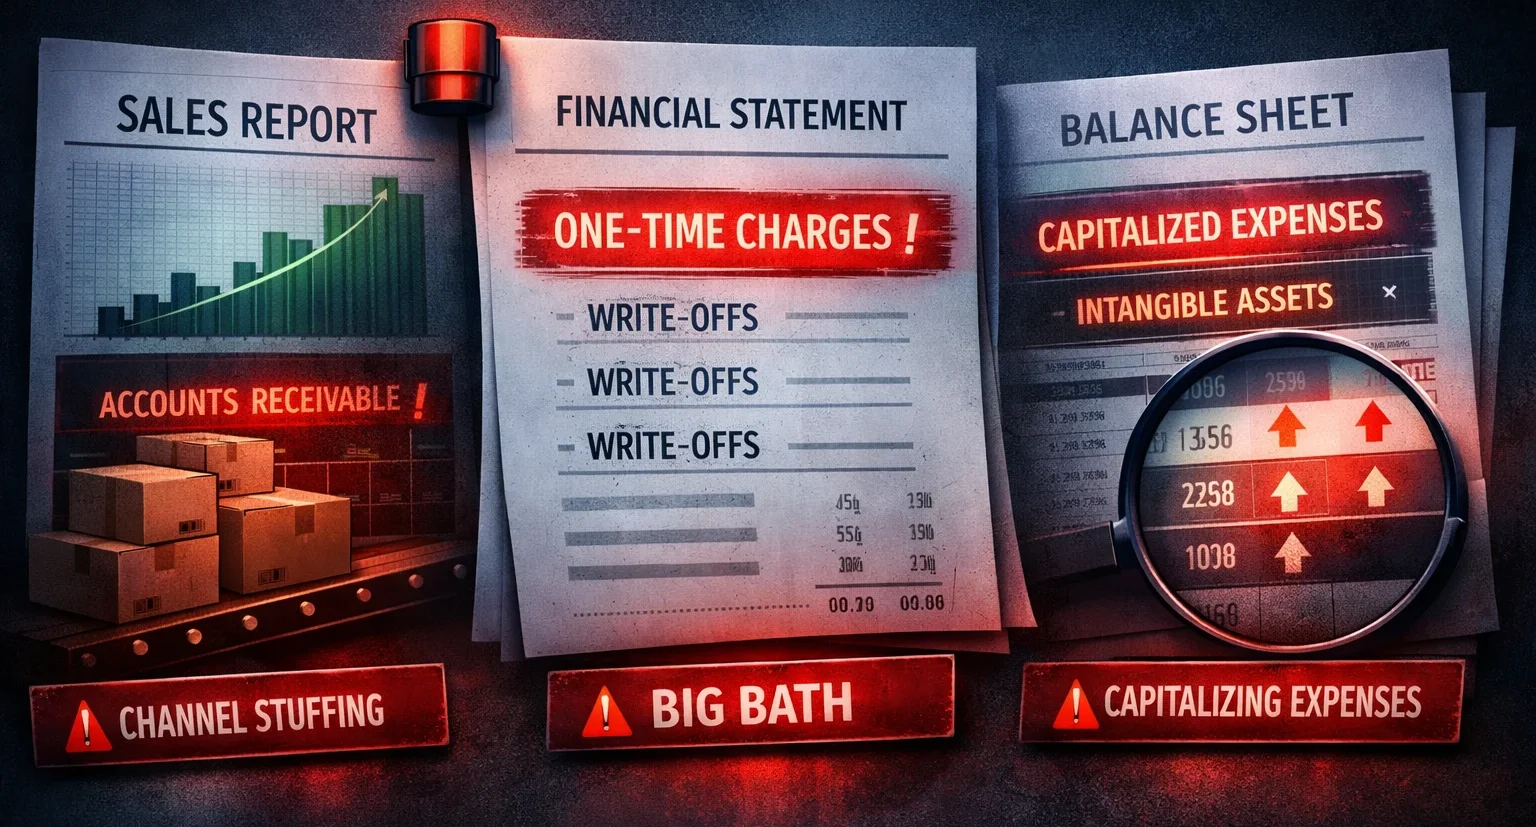
Spotting Creative Accounting & Window Dressing
Financial statements aren’t always 100% objective. Management often uses the “gray areas” of accounting to perform window dressing, manipulating numbers to fit a specific narrative.
Common “Creative” Tactics
Channel Stuffing: Shipping excessive products to distributors right before the quarter ends to inflate revenue.
- Red Flag: Check Accounts Receivable. If sales are up but cash hasn’t been collected, they may be “stuffing the channel.”
The “Big Bath”: When a year is already bad, a company might pack in every possible write-off and future liability at once.
- The Goal: “Clear the decks” so that future years look artificially profitable by comparison.
Capitalizing Expenses: Treating an everyday cost (like maintenance) as an asset rather than an expense.
- The Result: It hides the cost on the Balance Sheet and spreads it over years through depreciation, masking a drop in current profit.
Summary of Red Flags
| Tactic | What it Hides | Where to Find it |
|---|---|---|
| Channel Stuffing | Weak demand | High Accounts Receivable vs. Sales |
| Big Bath | Future costs | Massive “One-time” Charges |
| Capitalizing Expenses | Low margins | Unusual rise in Fixed/Intangible Assets |
Financial Statements for the Digital Economy
Traditional accounting was built for factories, not software. In the digital world, applying old rules can lead to wrong conclusions.
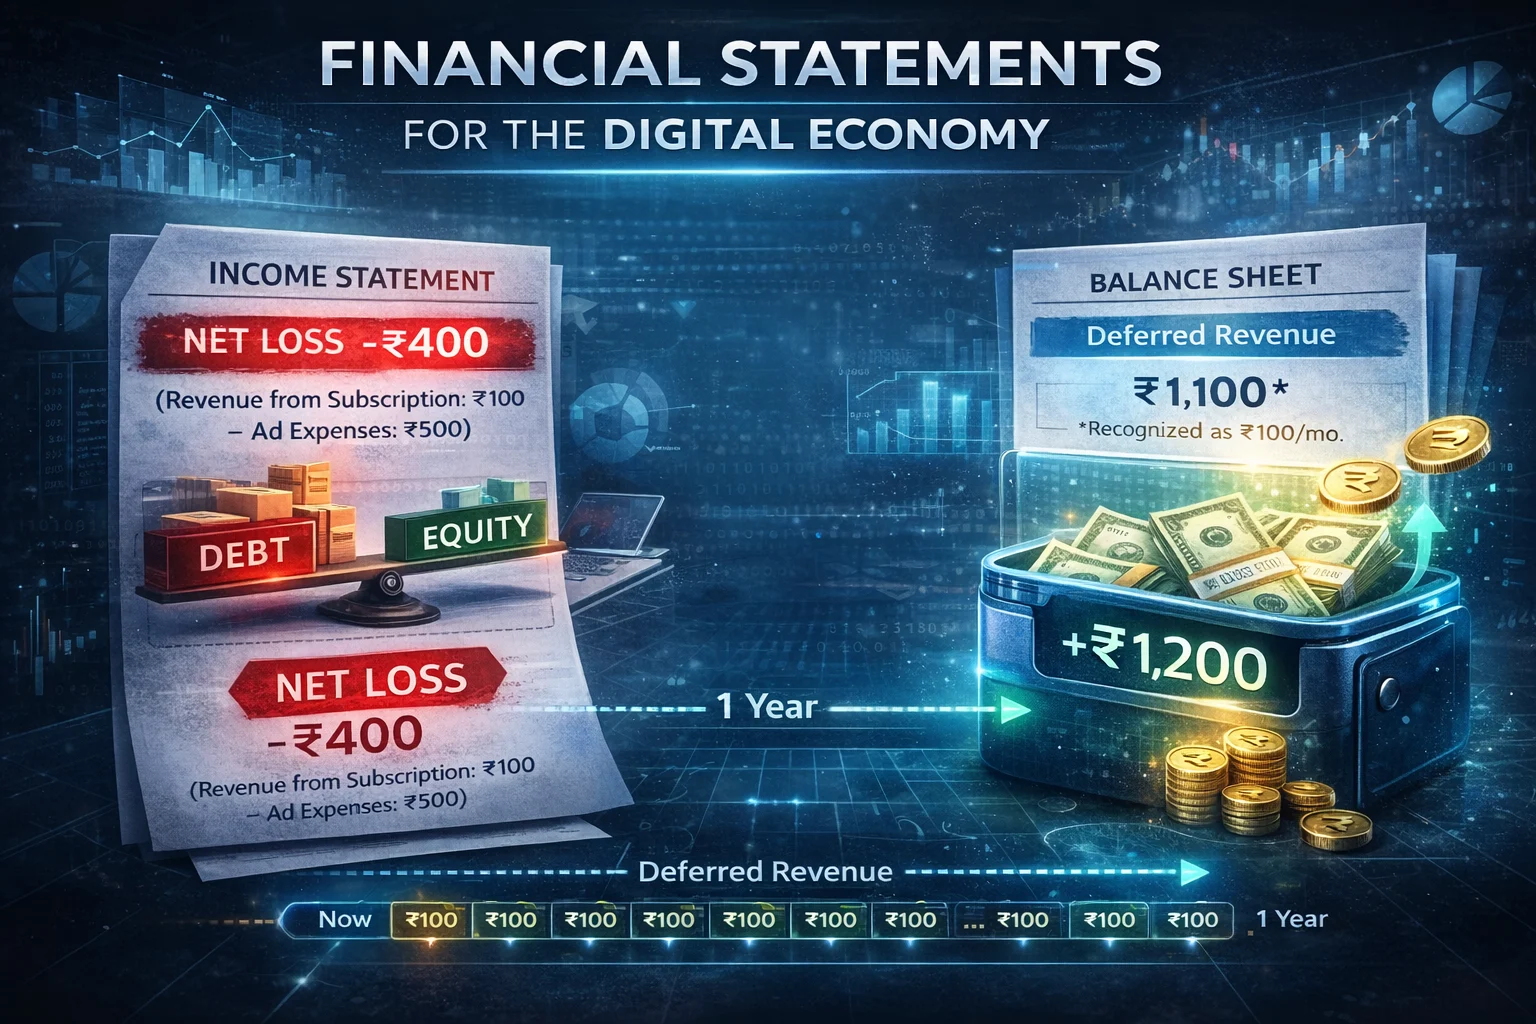
The SaaS Paradox: Net Loss vs. Positive Cash Flow
A tech company can show a Net Loss while having Positive Cash Flow. This is usually due to Deferred Revenue.
- The Scenario: A customer pays Rs. 1,200 upfront for a 1-year subscription.
- Cash Flow: The company gets Rs. 1,200 instantly.
- Income Statement: Accounting rules only allow them to recognize Rs. 100/month. If they spent Rs. 500 on ads to get that customer, the month shows a Rs. 400 loss on paper, despite having Rs. 1,200 in the bank.
The Shift in Metrics
| Traditional Industry | Digital / SaaS Industry |
|---|---|
| Main Asset: Machinery & Inventory | Main Asset: Intellectual Property (Code/Data) |
| Major Cost: Raw Materials (COGS) | Major Cost: Customer Acquisition (CAC) |
| Key Metric: Gross Margin | Key Metric: Lifetime Value (LTV) |
The Lesson for Investors: In tech, don’t panic over a red “Bottom Line.” Check Unearned/Deferred Revenue on the Balance Sheet. If that number is growing, future guaranteed income is stacking up.
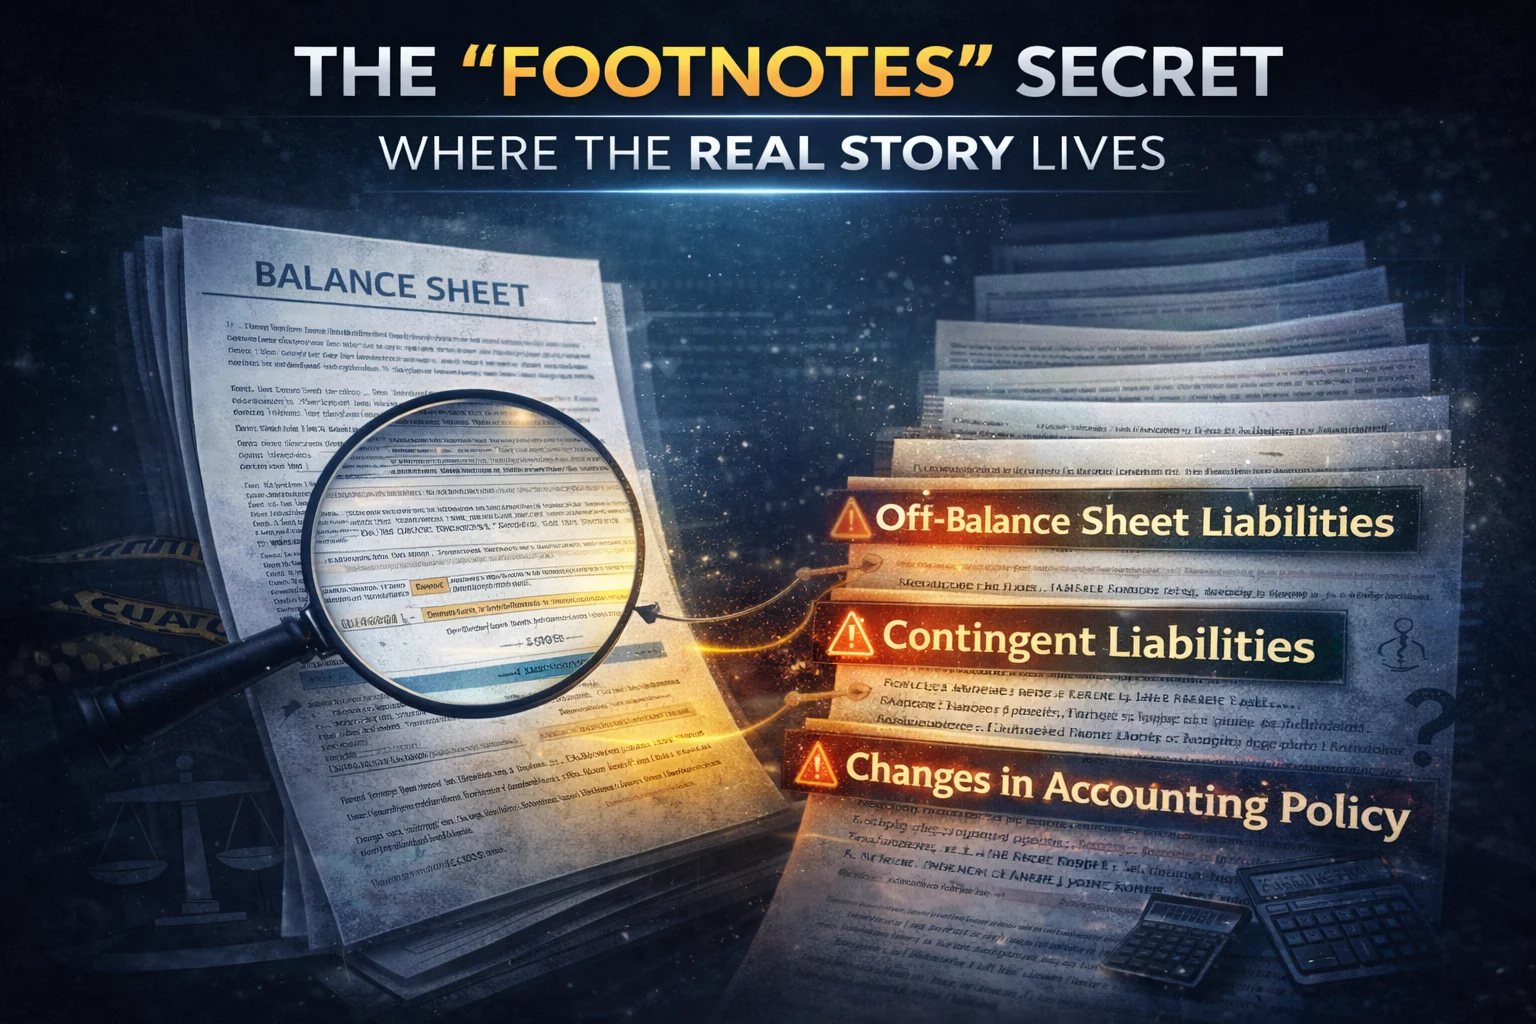
The Footnotes Secret: Where the Real Story Lives
Most people stop reading after the colorful charts and the three main pages. However, the most critical details regarding the financial statements of companies are often buried in the 50+ pages of fine print that follow. If the main statements are the “highlights,” the footnotes are the “uncut footage.”
To find the truth, you must look for these three hidden elements:
1. Off-Balance Sheet Liabilities
Companies sometimes keep significant obligations hidden from the main balance sheet. This might include joint ventures or special purpose entities. If a company is responsible for a debt but doesn’t list it as a liability, you could be walking into a trap.
2. Contingent Liabilities (Pending Lawsuits)
Is the company about to lose a billion-dollar court case? You won’t find that on the Income Statement yet. The footnotes contain a section on Contingent Liabilities, which lists pending lawsuits, government investigations, and product warranties that could drain cash in the future.
3. Changes in Accounting Policies
If a company suddenly changes its depreciation method (e.g., from “Accelerated” to “Straight-Line”), it can artificially boost earnings without selling a single extra product. The footnotes must disclose these changes. Always ask: Are they changing the rules because the business is growing, or to hide a decline?
Benchmarking: What Is a “Good” Number?
A “good” number is entirely relative. When analyzing the financial statements of companies, comparing a jeweler to a supermarket is like comparing a sprinter to a marathon runner. They have different goals and different structures.
To truly understand performance, you must use Vertical-Specific Comparisons. These ranges are broad industry norms. Always compare companies of similar size and geography.
The Industry Benchmarking Cheat Sheet
| Industry | Target Net Profit Margin | Critical Metric to Watch |
|---|---|---|
| Grocery / Retail | 1% – 3% | Inventory Turnover: How fast do goods leave the shelf? |
| Software (SaaS) | 20% – 35% | Churn Rate: How many customers are leaving? |
| Pharmaceuticals | 15% – 20% | R&D Spend: Are they investing in future drugs? |
| Heavy Manufacturing | 5% – 10% | Asset Utilization: Is the machinery being used efficiently? |
| Banking | 10% – 15% | NPA Ratio: What percentage of loans are not being repaid? |
Why Margins Vary
A grocery store has low margins but high volume, they sell milk every day. A software company has high margins because once the code is written, selling it to the 1,000th customer costs almost nothing. When reviewing financial statements, always benchmark against the industry average, not the global market.
The Satyam Case Study
In 2009, Satyam Computer Services was the “crown jewel” of India’s IT sector, the fourth-largest company in the industry. On paper, it was a global powerhouse with healthy profits and a massive cash reserve. Investors and analysts were captivated by the numbers.
The Confession that Rocked the Market
On January 7, 2009, Chairman Ramalinga Raju released a historic five-page confession letter. He admitted that the company’s success was a massive accounting fiction. He described the fraud as “riding a tiger, not knowing how to get off without being eaten.”
The Paper Success vs. The Financial Reality
The investigation by SEBI and the CBI revealed a massive disconnect between the Income Statement (Profit) and the Balance Sheet (Cash).
| Financial Metric (Sept 30, 2008) | Reported Figures | Actual Figures | The Fraudulent Gap |
|---|---|---|---|
| Cash & Bank Balances | Rs. 5,361 Crore | Rs. 321 Crore | Rs. 5,040 Cr (Fake) |
| Operating Margin | Rs. 649 Cr (24%) | Rs. 61 Cr (3%) | 10x Overstated |
| Quarterly Revenue | Rs. 2,700 Crore | Rs. 2,112 Crore | Rs. 588 Cr (Fake) |
| Accrued Interest | Rs. 376 Crore | Nil | Rs. 376 Cr (Fake) |
The Mechanics of the Fraud
To keep the illusion alive, the management used several “creative accounting” tactics:
- The Ghost Employees: Satyam claimed to have 53,000 employees but actually had only 40,000. The company withdrew approximately Rs. 20 crore every month to pay these 13,000 non-existent people, transferring the funds elsewhere.
- Fake Invoices: Over 6,000 forged invoices were generated to inflate revenue.
- Fabricated Bank Statements: Raju admitted to manually creating fake bank statements to prove the existence of the non-existent Rs. 5,040 crore in cash.
The Result: A Liquidity and Wealth Disaster
When the truth exploded, the consequences were immediate and devastating:
- Stock Market Crash: Satyam’s share price plummeted from a high of Rs. 544 to just Rs. 11.50, a 98% wipeout of shareholder value.
- Investor Wealth: Over $2.8 billion (Rs. 14,000+ Cr) in investor wealth evaporated almost overnight.
- Trust Deficit: The SENSEX fell over 7% (700 points) in a single day as panic spread across the Indian corporate sector.
The Ultimate Lesson: Profit is an Opinion; Cash is a Fact
The Satyam scandal proves that while an Income Statement can show “Strong Profits” through engineering, the Balance Sheet’s cash must be real to sustain a business.
Red Flag for Investors: If a company reports high profits but the Cash Flow from Operations remains low or the interest earned on “Cash at Bank” doesn’t match market rates, the numbers are likely being manipulated. In Satyam’s case, the “fake cash” was supposedly sitting in non-interest-bearing accounts: a massive red flag that went ignored for years
Few related topics for your knowledge
- Job Guarantee Vs Job Assistance: Core Points Of Differences Between The Two
- 10 Life Changing Simulation Softwares To Learn In Upcoming Years
- Top 20 Journal Entries Questions And Answers For Interview
- 15 Essential Inventory Valuation Questions & Answers For Interview
- 50 Important Cash Book Questions & Answers For Interview Preparation
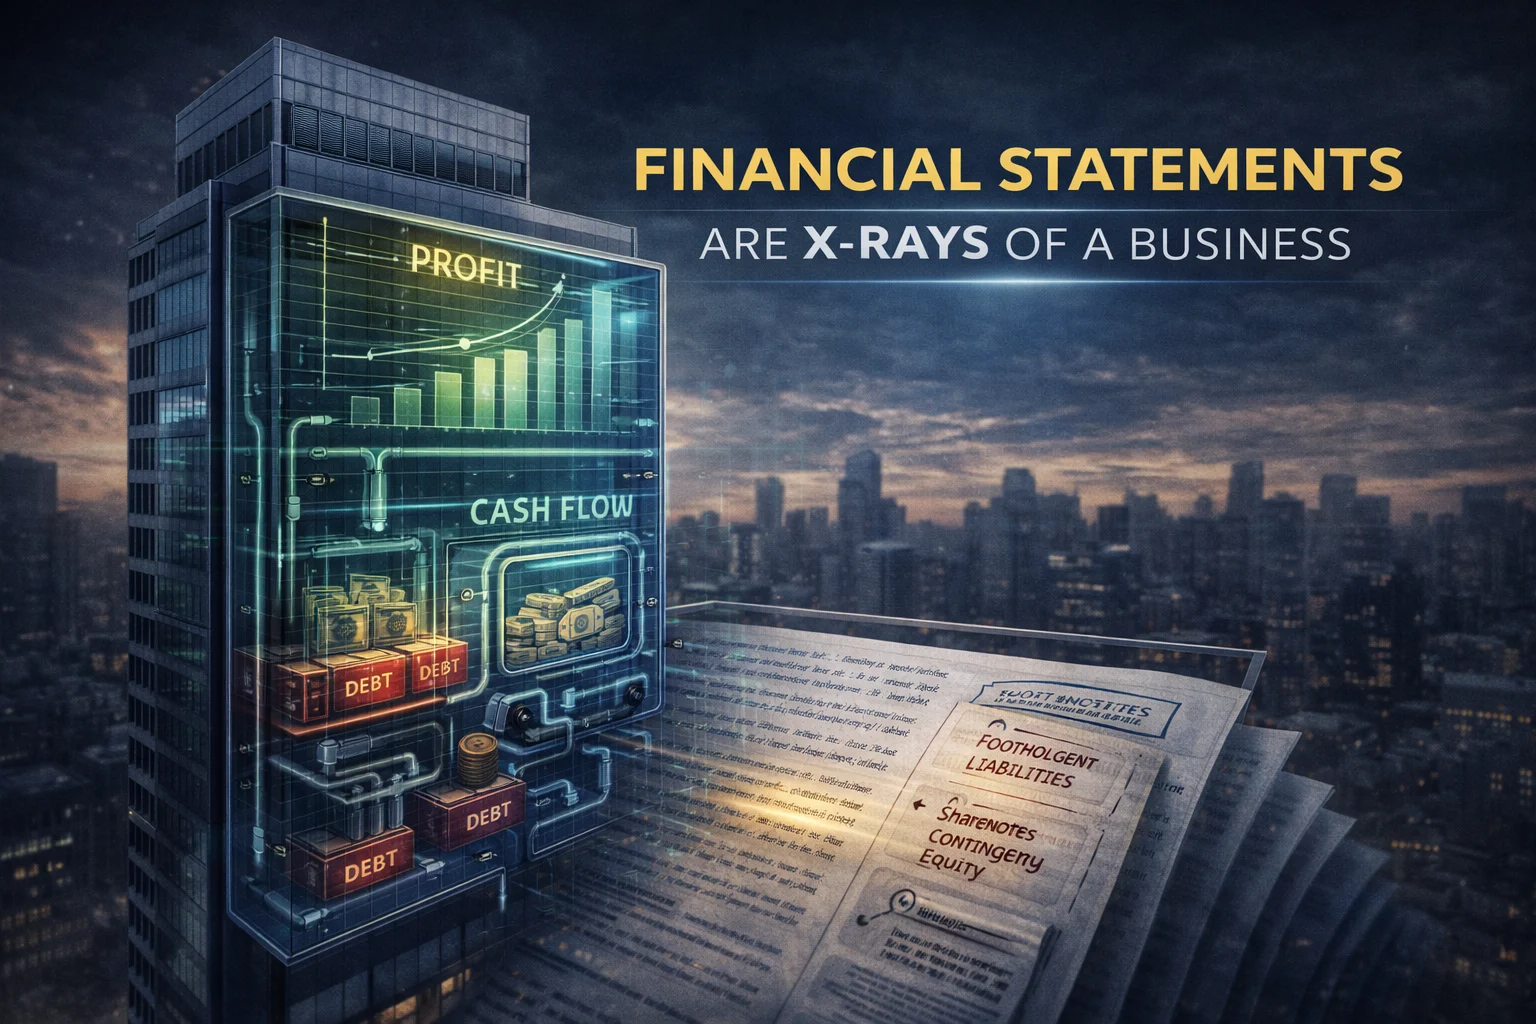
Conclusion
Financial statements are not paperwork. They are x-rays of a business.
The Income Statement shows the story management wants you to see. The Cash Flow Statement shows whether the business can actually survive. The Balance Sheet reveals the risk hiding beneath the surface.
If you only look at profit, you’re investing blind. If you ignore cash flow, you’re gambling. If you skip the footnotes, you’re trusting management without verification.
Real investors don’t chase headlines. They read numbers.
So the next time a company announces “record profits,” don’t celebrate. Open the annual report. Check the operating cash flow. Look at the debt trend. Scan the notes for red flags.
Marketing sells narratives. Financial statements reveal truth.
Learn to read them properly and you’ll never look at a business the same way again.
Frequently Asked Questions
1. Why does a profitable company go bankrupt?
A company can show a profit on its Income Statement but still run out of cash. This happens when their “Paper Profit” is tied up in Accounts Receivable or inventory, leaving them with no “Cold Hard Cash” to pay their immediate bills.
2. How do I read the financial statements of companies in 5 minutes?
Focus on three things: 1. Compare Cash Flow from Operations to Net Income. 2. Check if the Debt-to-Equity trend is rising. 3. Look for “Other Income” that might be a one-time boost rather than sustainable growth.
3. What is the difference between EBITDA and Net Income?
EBITDA stands for Earnings Before Interest, Taxes, Depreciation, and Amortization. It shows operational performance without accounting for debt costs or taxes. Net Income is the final profit after all costs are deducted. Investors often prefer EBITDA for valuing a business.
4. How do I know if the numbers are actually audited?
Check the “Auditor’s Report” section. You want to see an Unqualified Opinion. This means the auditor found the records to be clean. A “Qualified Opinion” is a red flag that something might be wrong with the data.
5. Does a high Accounts Receivable balance mean the company is doing well?
Not necessarily. While it shows high sales, it can also mean the company is struggling to collect money from its customers. If this balance grows faster than sales, it could lead to “bad debt” and future losses.
- You’re Smart Enough, But English Is Holding You Back. A Fluent English Speaking Course Can Fix That - July 3, 2026
- Movement Types in SAP MM: What They Are, Why They Matter, and How to Master Them - June 26, 2026
- No Experience? No Problem. Here’s How Freshers Are Landing SAP FICO Jobs in India Right Now - June 19, 2026