null

Course Overview

Our Power BI course in Bangalore follows the report-building cycle that BI teams at GCCs, IT services firms, and consultancies run every week, from raw data to a shared live dashboard.

  • Introduction to Power BI

    Get comfortable with Power BI Desktop, connect your first data source, and build a report from a blank canvas. Understand how analytics teams in Bangalore structure a dashboard before touching a visual.

  • Prepare Data in Power BI

    Clean, reshape, and combine messy Excel, CSV, and database files before any chart is drawn. This is the step that consumes most of a BI analyst's day, and the one interviewers probe the hardest.

  • Publish Power BI Reports

    Move finished reports from Desktop to the cloud so stakeholders see one version of the numbers. Learn the publishing flow that lets teams across Whitefield, Manyata, and the Outer Ring Road work from the same file.

  • Power BI Service Essentials

    Work inside Power BI Service: organise workspaces, share dashboards, and keep reports current. This is where Bangalore's shared-service and reporting teams spend their working day with live business data.

  • Tooltip Reports & Slicers

    Create tooltip pages and slicers that let a viewer filter by region, product, or month without calling the analyst. Interactive reporting like this is what separates a dashboard from a table.

  • Buttons, Bookmarks & Maps

    Add buttons, bookmarks, and geographical map visuals to guide the viewer through a story, step by step. You finish with an interactive report you can show an interviewer on your own laptop.

Course Syllabus

Lecture 1 : Introduction to Power BI
Lecture 2 : Prepare Data in Power BI
Lecture 3 : Publish Power BI
Lecture 4 : Service Power BI
Lecture 5 : Desktop Tooltip Reports & Slicers in Power BI
Lecture 6 : Buttons & Bookmarks in Power BI

Module Benefit

Module Benefits:

Artificial Intelligence (Al) | Allows Analysis and Sharing of Big Data Personalized Dashboards and Interactive Reports | Access to Information in Real-time | Excel integration | Profuse Data Sources Support and Integration | Interactive UI/UX Features

Lecture 1 : Flash Fill & Data Validation
Lecture 2 : Advanced Conditional Formatting
Lecture 3 : ASAP Utilities
Lecture 4 : Lookup Functions
Lecture 5 : Match & Index
Lecture 6 : Dynamic Viookup
Lecture 7 : Data Table
Lecture 8 : Solver
Lecture 9 : Financial Functions
Lecture 10 : Sort & Filter
Lecture 11 : PowerPivot
Lecture 12 : Dashboard Creation
Lecture 13 : Power Map & Power Query
Lecture 14 : Macro
Lecture 15 : Array Functions
Lecture 16 : Google Drive
Lecture 17 : Mail Merge

Module Benefit

Module Benefits:

By understanding Advanced MS Excel Course, students will have the ability to use more sophisticated functions, which will allow them to analyse complex and large volume of data to present meaningful information helping in decision making.


Lecture 1 : Hello to Google Drive
Lecture 2 : Introduction to Google Sheet
Lecture 3 : Google Sheet Protection
Lecture 4 : Combine Data from Multiple Google Sheet
Lecture 5 : Google Slides
Lecture 6 : Google Form
Lecture 7 : Google Mail Merge
Lecture 8 : Google Cloud Printing

Module Benefit

Module Benefits:

Domain-based email | Improved team collaboration | Video conferencing | Enhanced data security and Privacy.

Lecture 1 : Google Data Studio
Lecture 2 : Creating Charts & Graphs
Lecture 3 : Filters & Controls
Lecture 4 : Custom Fields
Lecture 5 : Chart Styling
Lecture 6 : User Management: Sharing your Reports

Module Benefit

Module Benefits:

Access unlimited widget options | Pull data from multiple sources | Share Data Studio reports easily | Create easy-to-read reports for everyone | Get dynamic reporting | Build interactive experiences

Lecture 1 : Macro
Lecture 2 : Introduction to VBA
Lecture 3 : Working with Procedures & Functions
Lecture 4 : Customizing the VBA Environment
Lecture 5 : Understanding the Objects
Lecture 6 : Variables & Intrinsic Functions
Lecture 7 : Controlling Program Execution
Lecture 8 : Debugging Code & Handling Errors
Lecture 9 : VBA Programming Functions
Lecture 10 : Excel Form Control & ActiveX
Lecture 11 : Working with Forms & Controls

Module Benefit

Module Benefits:

Automates repetitive and routine tasks | Accessibility to other users | Reduces the formulas burden used in Excel reports | Reduces the turnaround time.

Lecture 1 : Introduction to SQL
Lecture 2 : Platforms to execute SQL codes
Lecture 3 : Creating a table
Lecture 4 : Data insertion
Lecture 5 : Auto increment and primary key
Lecture 6 : Alter table
Lecture 7 : Delete
Lecture 8 : Update
Lecture 9 : Top clause
Lecture 10 : String functions
Lecture 11 : Aggregate functions
Lecture 12 : Constraints
Lecture 13 : SQL join
Lecture 14 : Insert sub-query
Lecture 15 : Delete sub-query

Module Benefit

Module Benefits:

Commonality & Simplicity | Integrate easily with other programming languages | Ability to function at a high operating speed | No need of complex coding skills for data extraction.

Watch a Dashboard Get Built First

Sit in on a trial session at our Bangalore centre and see our Power BI classes in Bangalore before you enrol.

Reserve My Trial Session

Demand for Power BI Course in Bangalore

  • Bengaluru Leads GCC Hiring

    Bengaluru holds about 30% of India's GCC hiring, projected at 5.1 lakh jobs in 2026, with data science and analytics skills driving much of it.

  • 1,900+ Power BI Jobs Listed

    Glassdoor showed 1,921 Power BI openings in Bengaluru in September 2026, with Infosys, Capgemini, Beghou, and 7N among the employers advertising.

  • Power BI Outpaces Tableau

    Across 2,310 analyst postings tracked May to July 2026, Power BI appeared in 21.8% against Tableau's 13.5%, driven by Microsoft-stack adoption.

  • Karnataka's 500+ GCC Base

    Karnataka hosts over 500 global capability centres with 6 lakh+ employees. Reporting and analytics desks sit across Whitefield, Outer Ring Road, and Manyata.

Career Opportunities

Roles you can target after a Power BI course in Bangalore

  • Power BI Developer

    Build and maintain dashboards, data models, and scheduled reports for IT services firms and product companies across Bangalore's tech corridors..

    ₹4.9 – 9.0 LPA

  • Power BI Analyst

    Turn sales, finance, and operations data into weekly dashboards that business teams at Bangalore GCCs use for decisions.

    ₹4.0 – 7.0 LPA

  • Data Analyst

    Clean datasets, track KPIs, and present trends in Power BI for analytics teams at Bangalore consultancies and retail-tech firms.

    ₹4.5 – 7.0 LPA

  • Reporting Analyst

    Own recurring MIS and management reports, replacing manual Excel packs with refreshable Power BI views for Bangalore finance teams.

    ₹5.0 – 10.0 LPA

  • Power BI Consultant

    Gather requirements, design reports, and deliver dashboards for clients at analytics and advisory firms with Bengaluru offices.

    ₹7.0 – 9.0 LPA

  • Senior Power BI Engineer

    Lead report architecture and mentor junior analysts at data and analytics solution providers hiring in Bengaluru.

    ₹12.0 – 18.0 LPA

Power BI Certification

Finish the course, clear the final assessment, and you earn an ICA Edu Skills certificate endorsed by the National Skill Development Corporation (NSDC), a Government of India body. Add this Power BI certification in Bangalore to your resume beside the dashboards you built, and show both at interviews.

MIS Certification

Salary Insights

  • Power BI developers in Bangalore earn a median of about ₹6.35 LPA, with the middle half paid ₹4.9–8.95 LPA.

  • Freshers with a solid Power BI portfolio reach ₹4.5–7 LPA, a ₹0.5–1.5 LPA premium over candidates limited to Excel-only MIS roles.

  • Reporting analysts with Power BI skills earn ₹5–10 LPA, while senior Power BI engineer listings in Bengaluru quote ₹12–18 LPA.

  • Consultant roles at analytics firms like Beghou list ₹7–9 LPA, and senior data analysts with Power BI skills average ₹13 LPA.

Sources: Glassdoor India (Aug–Sep 2026); Payscale India (2026); Cutshort (Aug 2026); PrepNPlaced (Jul 2026); BusinessToday (Jul 2026); Flexiple (2026)

Min salary Max salary
₹125k ₹100k ₹75k ₹50k ₹25k ₹0
Fresher
(0–1 yr)
Junior
(1–3 yrs)
Mid-level
(3–7 yrs)
Senior
(7+ yrs)
Monthly salary in ₹ · Bangalore market

Our Power BI Training Institutes in Bangalore

ICA Salt Lake
Bangalore Rajajinagar
Karnataka, Bengaluru
ICA Salt Lake
Nelamangala
Karnataka, Bengaluru
ICA Salt Lake
Bangalore - Yelahanka
Karnataka, Bengaluru
ICA Salt Lake
Bangalore Jayanagar
Karnataka, Bengaluru
ICA Salt Lake
Hubli
Karnataka, Bengaluru
ICA Salt Lake
Bangalore - HSR Layout
Karnataka, Bengaluru

Events and Activities

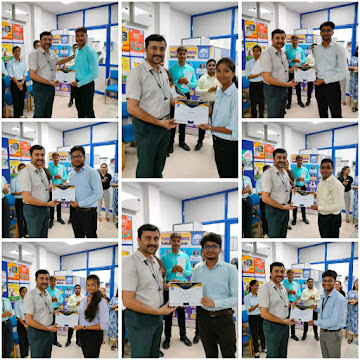
  • certificate distribution
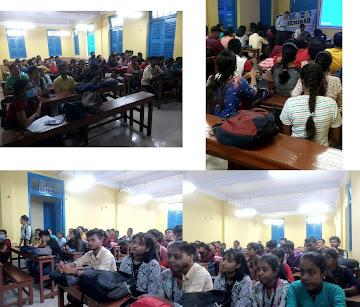
  • classroom
  • mock interview
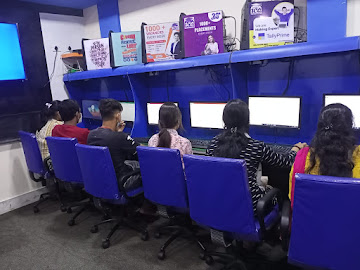
  • practical lab room
  • students

Our Alumni  Worked At

What Our Students' Says

Sufal Ghosh
Sufal Ghosh
...

This course gave a solid foundation in MIS and analytics. Some topics were challenging at first, but the step-by-step guidance helped. More real-life case studies would be nice, but overall, it’s a great start for beginners in data analysis.

Gabber Singh
Gabber Singh
...

ICA’s MIS course gave me practical skills in Excel, dashboards, and reporting that are directly useful in the workplace. The training was hands-on and easy to follow. Thanks to ICA’s placement support, I was able to secure a job shortly after completing the course.

Ratnakar
Ratnakar
...

ICA’s MIS Analysis course provided me with strong practical knowledge in data management and reporting. The hands-on training and real-time exercises enhanced my analytical skills. Ideal for a career in management

FAQs

Frequently Asked Questions

Yes. Lecture 2 is built around preparing data: connecting Excel, CSV, and database sources, then cleaning and reshaping them before reporting. Power BI's Excel integration also helps if your current work already lives in spreadsheets.

Yes. The course starts from the Power BI Desktop interface in Lecture 1 and builds step by step to publishing and interactive reports. No programming background is needed, and basic Excel familiarity is enough to begin.

Yes. Lectures 3 and 4 cover publishing from Desktop and working inside Power BI Service, so you learn how a report moves from your laptop to a shared workspace that colleagues and managers can open.

Yes. Lectures 5 and 6 cover tooltip reports, slicers, buttons, and bookmarks, and the module includes geographical maps. You finish with an interactive report that you can demonstrate live in an interview.

Power BI is a strong first pick. In 2,310 analyst postings tracked across India from May to July 2026, Power BI appeared in 21.8% against Tableau's 13.5%. It also fits Microsoft and Excel-based workplaces.

Yes. You learn to publish reports to Power BI Service with scheduled refresh and mobile-optimised layouts, the setup Bangalore's corporate teams use for real-time, on-the-go reporting.

Enquire Now

Share this page

Share this page’s details with your family and friends.