null

Course Overview

Our Power BI classes in Pune follow the report cycle analysts run at IT firms, banks, and manufacturers, from importing raw data to publishing a dashboard your whole team can open.

  • Power BI Fundamentals

    Learn the Power BI Desktop interface, report canvas, fields, and visuals. See how Excel files, databases and AI-powered visuals plug into one report, the base every Power BI interview starts from.

  • Data Preparation in Power Query

    Clean, merge, and reshape messy sales, HR, and finance files with Power Query. Fix data types, remove duplicates, and build relationships the groundwork behind every report a manager can trust.

  • Publishing & Power BI Service

    Publish reports to Power BI Service, build dashboards, create workspaces, and share them with teams. Access live data from anywhere, a daily need in Pune's hybrid IT and finance offices.

  • Tooltips, Slicers & Map Visuals

    Design tooltip report pages and slicers so managers can drill into regions, products or months on their own. Add geographical maps to plot zone-wise or branch-wise data across Pune.

  • Buttons & Bookmarks

    Add buttons, bookmarks, and page navigation to turn a flat report into an app-like experience. Switch views, reset filters, and walk executives through a data story in a few clicks.

  • Project-Led Learning

    Work on realistic datasets such as IT project utilisation, BFSI loan books and auto-plant quality logs, and finish with a portfolio dashboard you can walk interviewers through.

Course Syllabus

Lecture 1 : Introduction to Power BI
Lecture 2 : Prepare Data in Power BI
Lecture 3 : Publish Power BI
Lecture 4 : Service Power BI
Lecture 5 : Desktop Tooltip Reports & Slicers in Power BI
Lecture 6 : Buttons & Bookmarks in Power BI

Module Benefit

Module Benefits:

Artificial Intelligence (Al) | Allows Analysis and Sharing of Big Data Personalized Dashboards and Interactive Reports | Access to Information in Real-time | Excel integration | Profuse Data Sources Support and Integration | Interactive UI/UX Features

Lecture 1 : Flash Fill & Data Validation
Lecture 2 : Advanced Conditional Formatting
Lecture 3 : ASAP Utilities
Lecture 4 : Lookup Functions
Lecture 5 : Match & Index
Lecture 6 : Dynamic Viookup
Lecture 7 : Data Table
Lecture 8 : Solver
Lecture 9 : Financial Functions
Lecture 10 : Sort & Filter
Lecture 11 : PowerPivot
Lecture 12 : Dashboard Creation
Lecture 13 : Power Map & Power Query
Lecture 14 : Macro
Lecture 15 : Array Functions
Lecture 16 : Google Drive
Lecture 17 : Mail Merge

Module Benefit

Module Benefits:

By understanding Advanced MS Excel Course, students will have the ability to use more sophisticated functions, which will allow them to analyse complex and large volume of data to present meaningful information helping in decision making.


Lecture 1 : Hello to Google Drive
Lecture 2 : Introduction to Google Sheet
Lecture 3 : Google Sheet Protection
Lecture 4 : Combine Data from Multiple Google Sheet
Lecture 5 : Google Slides
Lecture 6 : Google Form
Lecture 7 : Google Mail Merge
Lecture 8 : Google Cloud Printing

Module Benefit

Module Benefits:

Domain-based email | Improved team collaboration | Video conferencing | Enhanced data security and Privacy.

Lecture 1 : Google Data Studio
Lecture 2 : Creating Charts & Graphs
Lecture 3 : Filters & Controls
Lecture 4 : Custom Fields
Lecture 5 : Chart Styling
Lecture 6 : User Management: Sharing your Reports

Module Benefit

Module Benefits:

Access unlimited widget options | Pull data from multiple sources | Share Data Studio reports easily | Create easy-to-read reports for everyone | Get dynamic reporting | Build interactive experiences

Lecture 1 : Macro
Lecture 2 : Introduction to VBA
Lecture 3 : Working with Procedures & Functions
Lecture 4 : Customizing the VBA Environment
Lecture 5 : Understanding the Objects
Lecture 6 : Variables & Intrinsic Functions
Lecture 7 : Controlling Program Execution
Lecture 8 : Debugging Code & Handling Errors
Lecture 9 : VBA Programming Functions
Lecture 10 : Excel Form Control & ActiveX
Lecture 11 : Working with Forms & Controls

Module Benefit

Module Benefits:

Automates repetitive and routine tasks | Accessibility to other users | Reduces the formulas burden used in Excel reports | Reduces the turnaround time.

Lecture 1 : Introduction to SQL
Lecture 2 : Platforms to execute SQL codes
Lecture 3 : Creating a table
Lecture 4 : Data insertion
Lecture 5 : Auto increment and primary key
Lecture 6 : Alter table
Lecture 7 : Delete
Lecture 8 : Update
Lecture 9 : Top clause
Lecture 10 : String functions
Lecture 11 : Aggregate functions
Lecture 12 : Constraints
Lecture 13 : SQL join
Lecture 14 : Insert sub-query
Lecture 15 : Delete sub-query

Module Benefit

Module Benefits:

Commonality & Simplicity | Integrate easily with other programming languages | Ability to function at a high operating speed | No need of complex coding skills for data extraction.

Your Resume Won't Show a Live Dashboard. Yet.

Enrol this month and start building on real business datasets in your first week at ICA's Pune centre.

Claim Your Seat Now

Demand for Power BI Course in Pune

  • 500+ Capability Centres in Pune

    KPMG counts 500+ GCCs in Pune, about 14% of India's total, with 130+ opened or expanded since 2024. Analyst roles at these centres regularly list Power BI

  • Hinjewadi, Kharadi & Magarpatta

    Hinjewadi (300+ firms), Kharadi (150) and Magarpatta (80) anchor Pune's IT map. Persistent, YASH Technologies and EPAM have all posted Power BI roles in the city.

  • Bajaj Finance & BFSI Analytics

    Bajaj Finance, headquartered in Pune, had 947 Power BI developer listings on Naukri in April 2026. Barclays also hires data analysts for its Pune campus.

  • Auto, Pharma & Manufacturing Data

    YASH Technologies is hiring Power BI developers for Pune pharma analytics, while the Chakan EV plant and Biotech Park add plant and quality reporting demand.

Career Opportunities

Roles you can target after a Power BI course in Pune

  • Junior Power BI Developer

    Build and refresh dashboards, clean data in Power Query, and handle report requests for IT services and GCC teams in Hinjewadi and Kharadi.

    ₹4.0 – 8.0 LPA

  • Data Analyst

    Turn Excel and database extracts into KPI and trend reports for BFSI, retail and automotive teams in Pune, then present findings to managers.

    ₹4.0 – 8.0 LPA

  • Reporting Analyst

    Own daily and monthly MIS dashboards for finance, risk and operations desks at banks and NBFCs around Kharadi, Viman Nagar and Shivajinagar.

    ₹4.0 – 7.0 LPA

  • Power BI Analyst

    Model data from several sources, design slicer-driven reports, and publish them in Power BI Service for sales, HR, and supply chain stakeholders.

    ₹5.0 – 9.0 LPA

  • Power BI Developer

    Lead report migrations, tune slow dashboards, and mentor juniors at Pune product firms, analytics consultancies, and global delivery centres.

    ₹8.0 – 20.0 LPA

  • Senior BI Developer / Lead

    Own the BI roadmap, govern workspaces, and guide enterprise reporting for GCCs and large manufacturers across Pune and Pimpri-Chinchwad.

    ₹20.0 – 30.0 LPA

Power BI Certification

Clear the final assessment and you receive an ICA Edu Skills certificate endorsed by the National Skill Development Corporation (NSDC). Our Power BI certification in Pune also overlaps Microsoft PL-300 skill areas such as data preparation and publishing, and Pune job posts often list Power BI certification as an added advantage.

MIS Certification

Salary Insights

  • Early-career Power BI developers in Pune average ₹4.98 LPA, with base pay starting near ₹4.07 LPA. Modelled fresher offers reach ₹5–8 LPA.

  • Pune job-posting data (July 2026) puts Power BI developers at ₹6.5–9.95 LPA, averaging about ₹7.9 LPA across listed roles.

  • Mid-level developers with 3–6 years earn ₹8.0–20.1 LPA. Persistent, YASH Technologies, and EPAM post Power BI roles in this experience band.

  • Pune's median Power BI developer CTC is ₹11.8 LPA, while senior profiles are modelled at ₹20.1–30.7 LPA across the city.

Sources: Payscale India Pune (2026); Hyring India Salary Model (2026); Jooble Pune (Jul 2026); Flexiple (Aug 2026); Naukri.com (Apr 2026); Indeed India

Min salary Max salary
₹125k ₹100k ₹75k ₹50k ₹25k ₹0
Fresher
(0–1 yr)
Junior
(1–3 yrs)
Mid-level
(3–7 yrs)
Senior
(7+ yrs)
Monthly salary in ₹ · Pune market

Our Power BI Training Institutes in Pune

ICA Salt Lake
Camp
Maharashtra, Pune
ICA Salt Lake
Chinchwad
Maharashtra, Pune
ICA Salt Lake
Dhankawadi
Maharashtra, Pune
ICA Salt Lake
Hadapsar
Maharashtra, Pune
ICA Salt Lake
Kothrud
Maharashtra, Pune
ICA Salt Lake
Tilak Road
Maharashtra, Pune

Events and Activities

  • certificate distribution
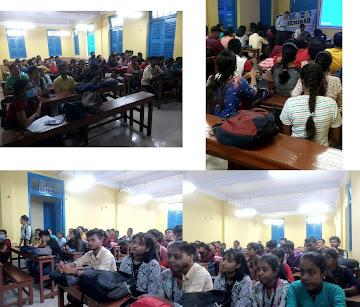
  • classroom
  • mock interview
  • practical lab room
  • students

Our Alumni  Worked At

What Our Students' Says

Sufal Ghosh
Sufal Ghosh
...

This course gave a solid foundation in MIS and analytics. Some topics were challenging at first, but the step-by-step guidance helped. More real-life case studies would be nice, but overall, it’s a great start for beginners in data analysis.

Gabber Singh
Gabber Singh
...

ICA’s MIS course gave me practical skills in Excel, dashboards, and reporting that are directly useful in the workplace. The training was hands-on and easy to follow. Thanks to ICA’s placement support, I was able to secure a job shortly after completing the course.

Ratnakar
Ratnakar
...

ICA’s MIS Analysis course provided me with strong practical knowledge in data management and reporting. The hands-on training and real-time exercises enhanced my analytical skills. Ideal for a career in management

FAQs

Frequently Asked Questions

Yes. You publish reports, build dashboards, set up workspaces, and share them with teammates, the exact flow hybrid Pune teams use. You also learn how refreshed data reaches stakeholders outside the office.

Yes. You import your Excel files, clean them in Power Query, and build slicer-driven dashboards that update on refresh, so a monthly manual report becomes a reusable one. No coding background is needed.

No. The course starts from the Power BI interface and uses Power Query's visual steps for data prep. Knowing basic Excel helps, and SQL becomes a useful add-on once you start applying to BFSI analyst roles.

Yes. You learn to publish reports to Power BI Service with scheduled refresh and mobile-optimised layouts, the setup Pune's corporate teams use for real-time, on-the-go reporting.

Yes. The slicers and map visuals module covers geographical maps, so you can plot data by city, zone, or branch and let viewers filter it with slicers and tooltips, a format Pune sales and operations teams ask for.

It builds the Power BI side of the profile, from data prep to published dashboards. Pune analyst postings usually also ask for Excel and SQL, so pair your portfolio dashboards with those skills when applying.

Enquire Now

Share this page

Share this page’s details with your family and friends.